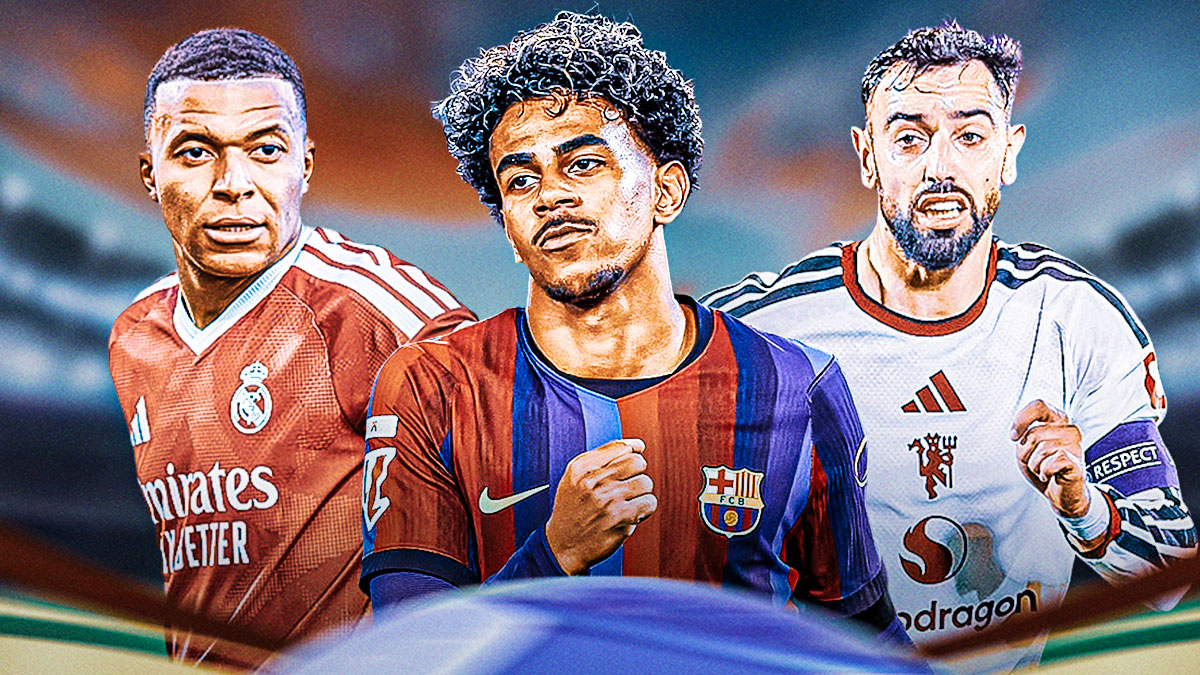
FC Barcelona had more in common with the NFL and Major League Baseball than with its closest soccer rivals in Zero1 Gaming’s October 2026 fan spending report. The study put Barcelona sixth among 45 fandoms, with an estimated $721.28 million in spending. The NFL and MLB were the only sports entries ahead of it. Manchester United and Real Madrid finished seventh and eighth, respectively, leaving Barcelona as the highest-ranked individual team in the study.
Sixth place sounds less impressive until you look at the company. Pokémon finished first at an estimated $1.71 billion, and the NFL came second at $1.36 billion. Disney and Super Mario followed before MLB rounded out the top five. Barcelona was the first individual club on a list that, to that point, had been led by entire leagues and entertainment franchises. Its position is striking because the study puts one club’s shopping demand on the same scale as all of those different kinds of fandom.
🚨🇧🇷| RECORD: Raphinha (29) is now Barcelona's 4TH-HIGHEST GOALSCORER in UEFA Champions League history! ✅
He has 23 goals, overtaking Neymar Jr. ⚽️🔝 pic.twitter.com/Rrrys4AAKu
— Kalshi FC (@KalshiFC) November 3, 2026
Barcelona’s edge starts with what fans searched for
Zero1 Gaming put Manchester United at $562.31 million and Real Madrid at $558.69 million. That leaves Barcelona about $159 million clear of United and $163 million ahead of Madrid in the model. The gaps are especially interesting because the study used the same price for each club’s signature item, a $100 replica jersey. Barcelona had the advantage before the model put a dollar value on any of those searches.
The club drew 12.32 million purchase-related searches in the study’s September 2026 data. Real Madrid drew 9.68 million, and Manchester United drew 9.63 million. Barcelona’s lead of more than 2.6 million searches over either club matters because the model applies the same purchase assumptions to each fandom. With the jersey price held constant, a bigger pool of searches produces a bigger estimate for that part of the calculation.
The report gives signature products more weight than any other purchase category. It assumes a 35% conversion rate for those products, compared with 17.5% for apparel, 5% for premium collectibles, and 1.25% for tickets. Across all 45 fandoms, signature items represented almost half of estimated spending. A jersey serves that role for a soccer club, just as a game can for a gaming franchise. That shared framework helps explain how Barcelona and Super Mario can occupy places on the same list.
There’s also a reason the jersey makes sense as the centerpiece of a sports fandom. As a Zero1 Gaming expert put it, “A jersey, a trading card, or a plush toy works like a membership badge, and fans are happy to pay for it when it ties them to a community.” The study can attach a price to the shirt. The quote gets at why the same basic item can mean so much more to the person wearing it.
What the MLB comparison says about Barcelona’s ranking
MLB offers a useful test of how far search volume alone can take a fandom. Baseball drew 10.42 million purchase-related searches, about 1.9 million fewer than Barcelona. Yet its estimated spending reached $822.23 million, roughly $101 million more. The study priced MLB’s replica jersey at $135, compared with $100 for Barcelona, and used $385 for baseball’s premium collectible, compared with about $196 for the club. Those differences help explain how MLB could sit one place higher despite attracting fewer searches.
Article Continues BelowThe reverse comparison with Real Madrid makes the point from another direction. Madrid’s average ticket price in the study was $159.70, comfortably above Barcelona’s $95.30. But tickets carried the lowest assumed conversion rate and accounted for just 4.6% of estimated spending across the study. A higher ticket price has relatively little leverage when the model assumes roughly one purchase per 80 searches. Barcelona’s advantage in search volume had more room to show up in the final ranking.
That distinction matters when the number at the center of the story is as precise as $721.28 million. Zero1 Gaming combined a month of Google search data with price research and assumptions about how often shoppers would buy. Each conversion rate is an input to the estimate. Even across all 45 fandoms, the study’s spending total ranged from $6.02 billion to $16.88 billion when it tested lower and higher conversion rates. Under those tests, every fandom stayed within two spots of its original rank. The dollar figures had room to swing much further than the order did.
That’s why Barcelona’s place on the list deserves more attention than the decimal points. Against Manchester United and Real Madrid, the club had a substantial search advantage with all three replica jerseys priced alike. Against MLB, the comparison shows how much prices can change the outcome even when Barcelona generates more searches. Taken together, those comparisons give the ranking some meaning beyond bragging rights. In the club comparison, the shared jersey price makes it easier to see what Barcelona brought to the calculation through its higher search volume.
The most telling detail may be the company Barcelona keeps on either side of sixth place. Below it sit two rival clubs that offer the same signature product at the same modeled price. Immediately above it sits an entire league whose higher-priced items helped it do more with fewer searches. Barcelona landed between them on the strength of shopping interest attached to a single club. That’s a better reason to pay attention to sixth place than the $721 million figure alone.